
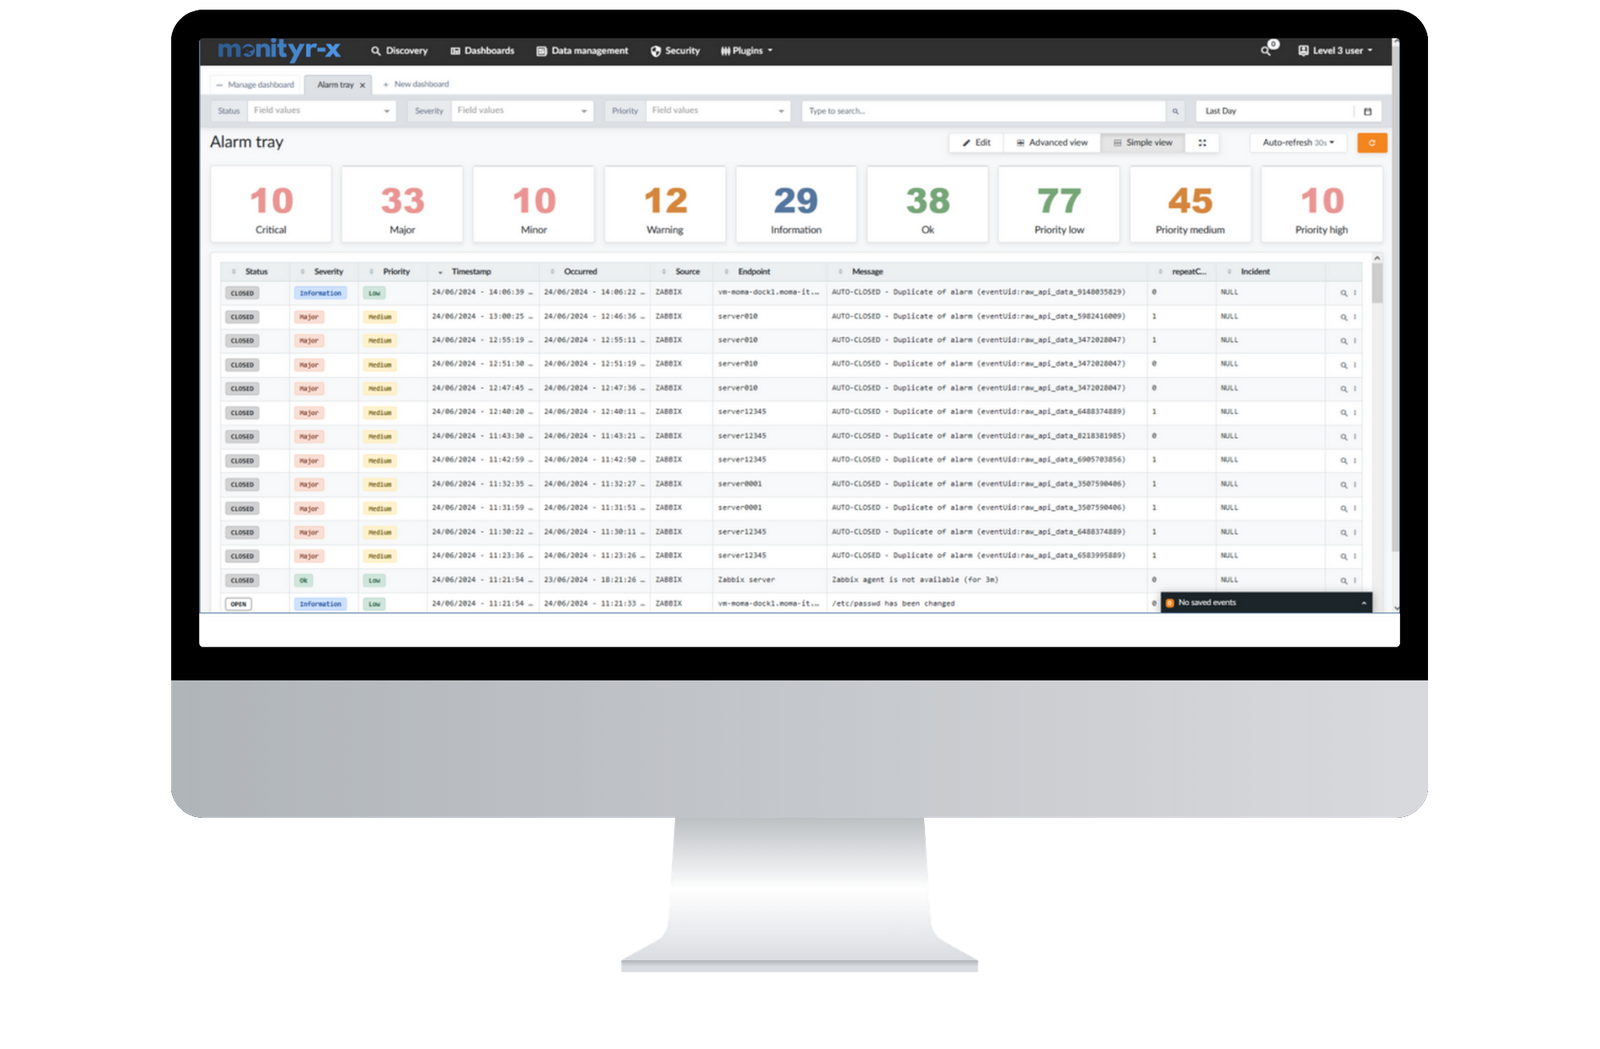
Alarm Tray
Monityr-x Alarm Tray consolidates alerts in a single location with customizable filters and views. Tailor alerts to match your team’s needs, and access all event data from one convenient interface.
- Centralized Platform to simplify event tracking.
- Customizable Views for efficient alert management.
- Advanced Filtering for quick access to relevant alerts.
- Trigger actions directly from event(s)
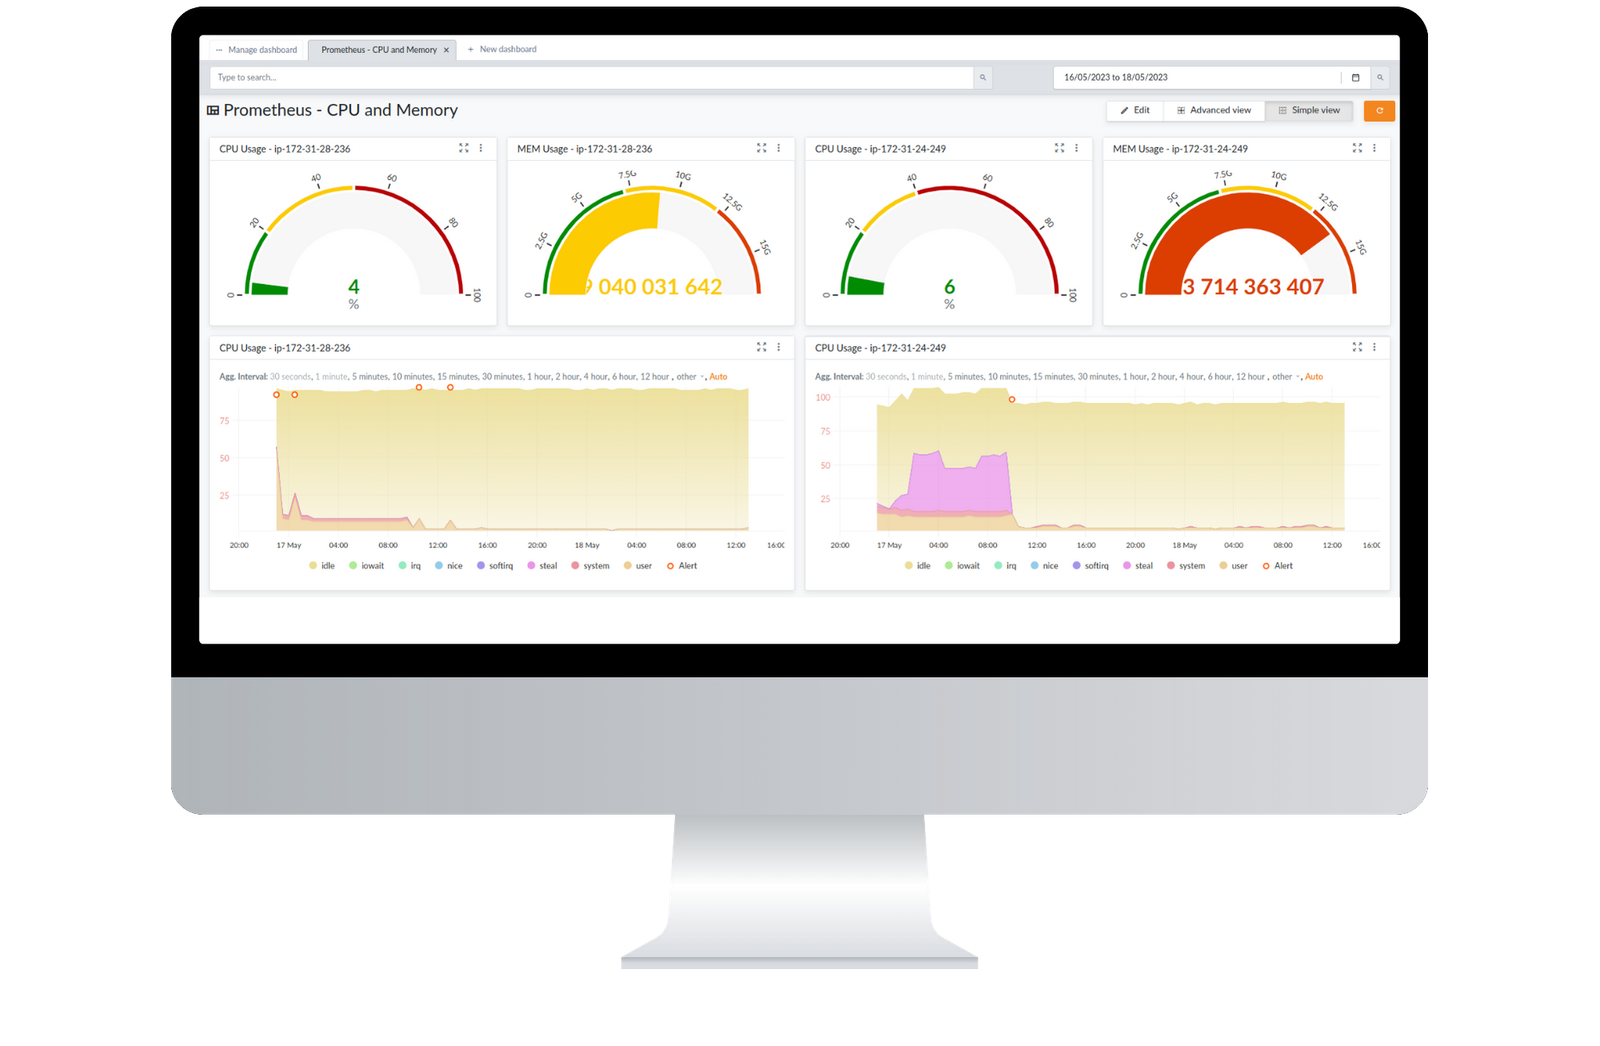
Dashboards – Metrics
Visualizing key performance indicators (KPI) with customisable real-time dashboards. Every metrics collected by monitoring are available through the connectivity capabilities of Grafana.
- Provide a standardized view of each IT asset
- Detect problem before getting notified by an impacted user
- Fully customisable & responsive design
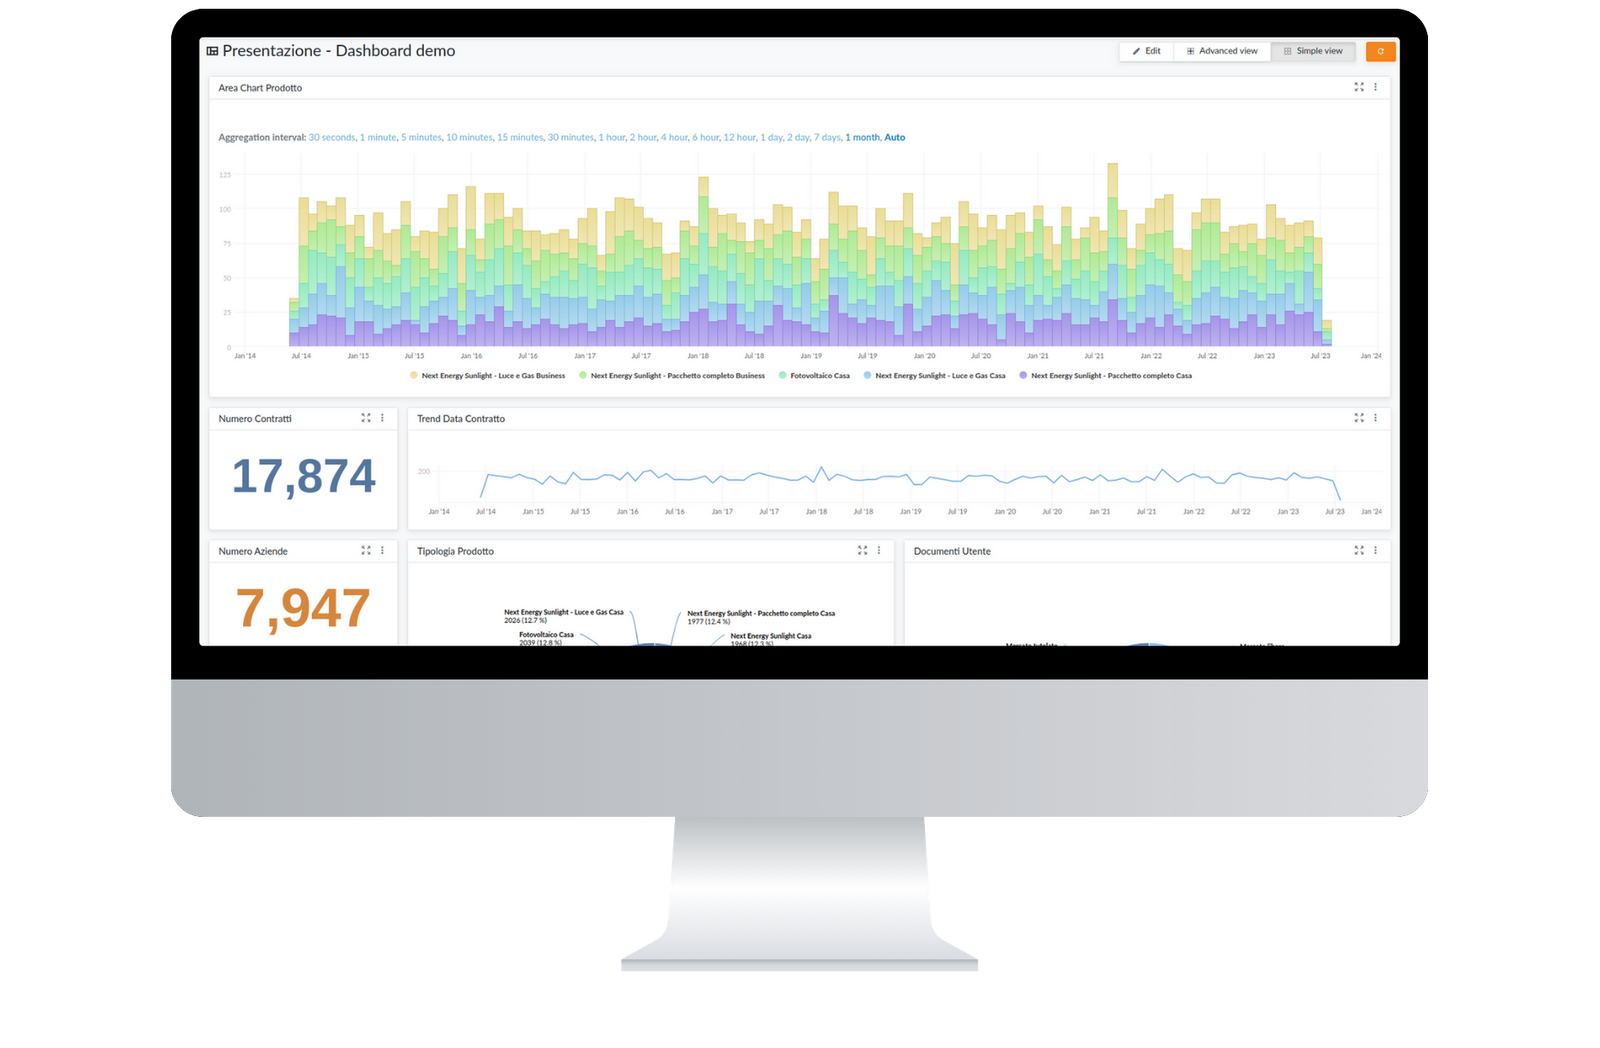
Dahsboards – Logs
Monityr-x Logs Dashboard provides an intuitive interface for analyzing log data from multiple sources in real time. Gain insights into system performance, security events, and operational metrics, all from a single view.
- Real-Time Monitoring: Track log data as it flows in, ensuring immediate visibility into critical events.
- Powerful Search and Filtering: Quickly find specific log entries using advanced search capabilities and customizable filters.
- Visual Analytics: Utilize graphs and charts to visualize log trends, making it easier to identify anomalies and patterns.
- Centralized Data Access: Consolidate logs from various sources, simplifying analysis and reporting.
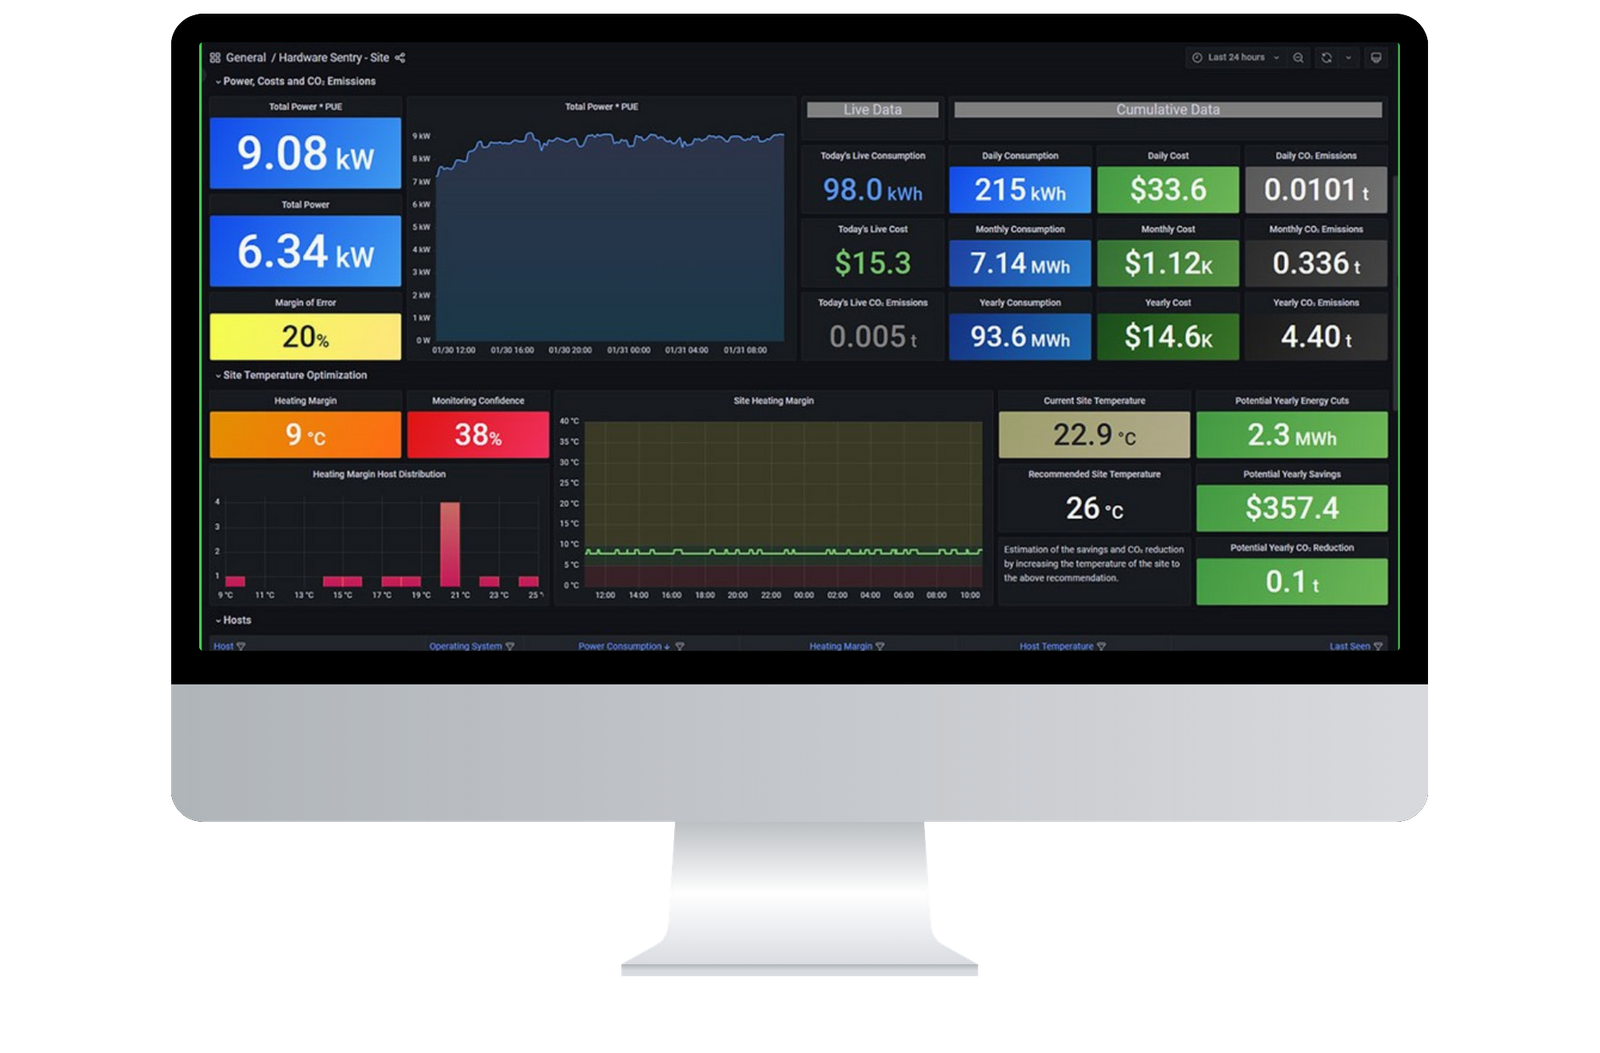
Dashboards – Green IT
Based on Monityr-x Monitoring (Hardware and Storage), Monityr-x Green IT will help you visualize in real time thermal indicators, electricity costs, and carbon emissions in order to help you managing and reducing costs.
- Create reports on the power consumption, costs and carbon footprint of your data centers.
- Calculate sustainability indicators of your infrastructure: PUE, CUE, WUE, ITUE
- Identify who are the biggest electricity consumers.
- Optimize the temperature of your data centers to reduce the electricity consumption of air conditioning (40% of the total) and therefore the corresponding carbon footprint.
Application View
Monityr-x application view offers a holistic look at application performance, from backend infrastructure to user interactions. Identify and resolve issues before they affect end users, ensuring reliable and responsive applications.
- Application related views with response times and features status
- Designed for business and applicative teams
- Comprehensive Insights from hardware to user experience.
- Enhanced User-Centric Monitoring for end-to-end visibility.

Business Process
Monityr-x Business Process helps to gain control of complex processes by facilitating their customization, governance and documentation, while ensuring consistency between expectation and actual outcomes.
- Allows the monitoring of business processes and the highlighting of the processing carried out
- Exceeds the monitoring limit for Silos and technologies used.
- Reduces the complexity of IT processes through summary views.
- Efficiently trigger actions from events and data reported by integrated sources.
